

Hey there!
Last week, we talked about when to update your process limits, and today we’re going to keep moving forward and dive into how to detect signals that indicate changes in your process.
At the beginning of our journey, we started with Detection Rule #1, which tells us that a single point outside of the calculated natural process limits (also known as three sigma limits) is a strong signal that something unusual has occurred.
This is the clearest sign of a signal because of its strength. When you detect this, it’s time to take action right away and identify what’s causing the deviation in your process.
How to Identify Process Issues Using the 4 Detection Rule
Now, let’s talk a bit more about those limits and go through each of them in detail.
Detection Rule #1: Clear Signals
If a data point falls outside of the three-sigma limits range, it signals that something outside the norm has occurred. This is what Detection Rule #1 is all about—a single point outside these limits signals that immediate action is required.
But that’s not the only way to detect signals. There are also moderate signals that suggest a process shift without as clear a deviation as Rule #1.
This leads us to Detection Rule #2.
Detection Rule #2: Moderate Changes
Detection Rule #2 states that if you observe two out of three successive values beyond one of the two sigma limits on the same side of the average, it’s likely signaling a moderate process change.
This is important because even if no point has gone beyond the three sigma limit, this pattern suggests something is starting to shift in your process. Investigating at this stage helps you catch issues before they become bigger problems.
Detection Rule #3: Sustained Process Shifts
Now, let’s move to Detection Rule #3. This rule indicates a more sustained change in your process. If you find that four out of five successive values fall beyond one of the one sigma lines (on the same side of the average), it’s likely signaling a moderate, sustained process shift.
Rule #3 increases the sensitivity of your signal detection and helps you spot sustained changes that may not be as obvious at first.
In this case:
- Four out of five successive data points beyond the one sigma limits (on the same side) is a moderate but sustained signal.
- This tells you that a gradual shift may have occurred in your process, requiring closer examination.
Detection Rule #4: Subtle but Important Shifts
Finally, Detection Rule #4 highlights even smaller changes. If you notice eight successive values on the same side of the average, this points to a small but sustained shift in your process.
While this may not seem as significant as a single point outside the three sigma limits, it’s crucial for maintaining a stable process over time.
Rule #4 helps you separate subtle signals from normal process noise and avoid missing important trends.
Why do these rules matter?
The key to successfully using these rules is understanding that the purpose of collecting data is to take action.
We use these rules to minimize the chances of making two common mistakes:
- Missing a signal and failing to address a real process issue.
- Treating normal variation as a signal and making unnecessary adjustments.
With the combination of these detection rules, we can eliminate approximately 99% of process noise and confidently identify when action is required.
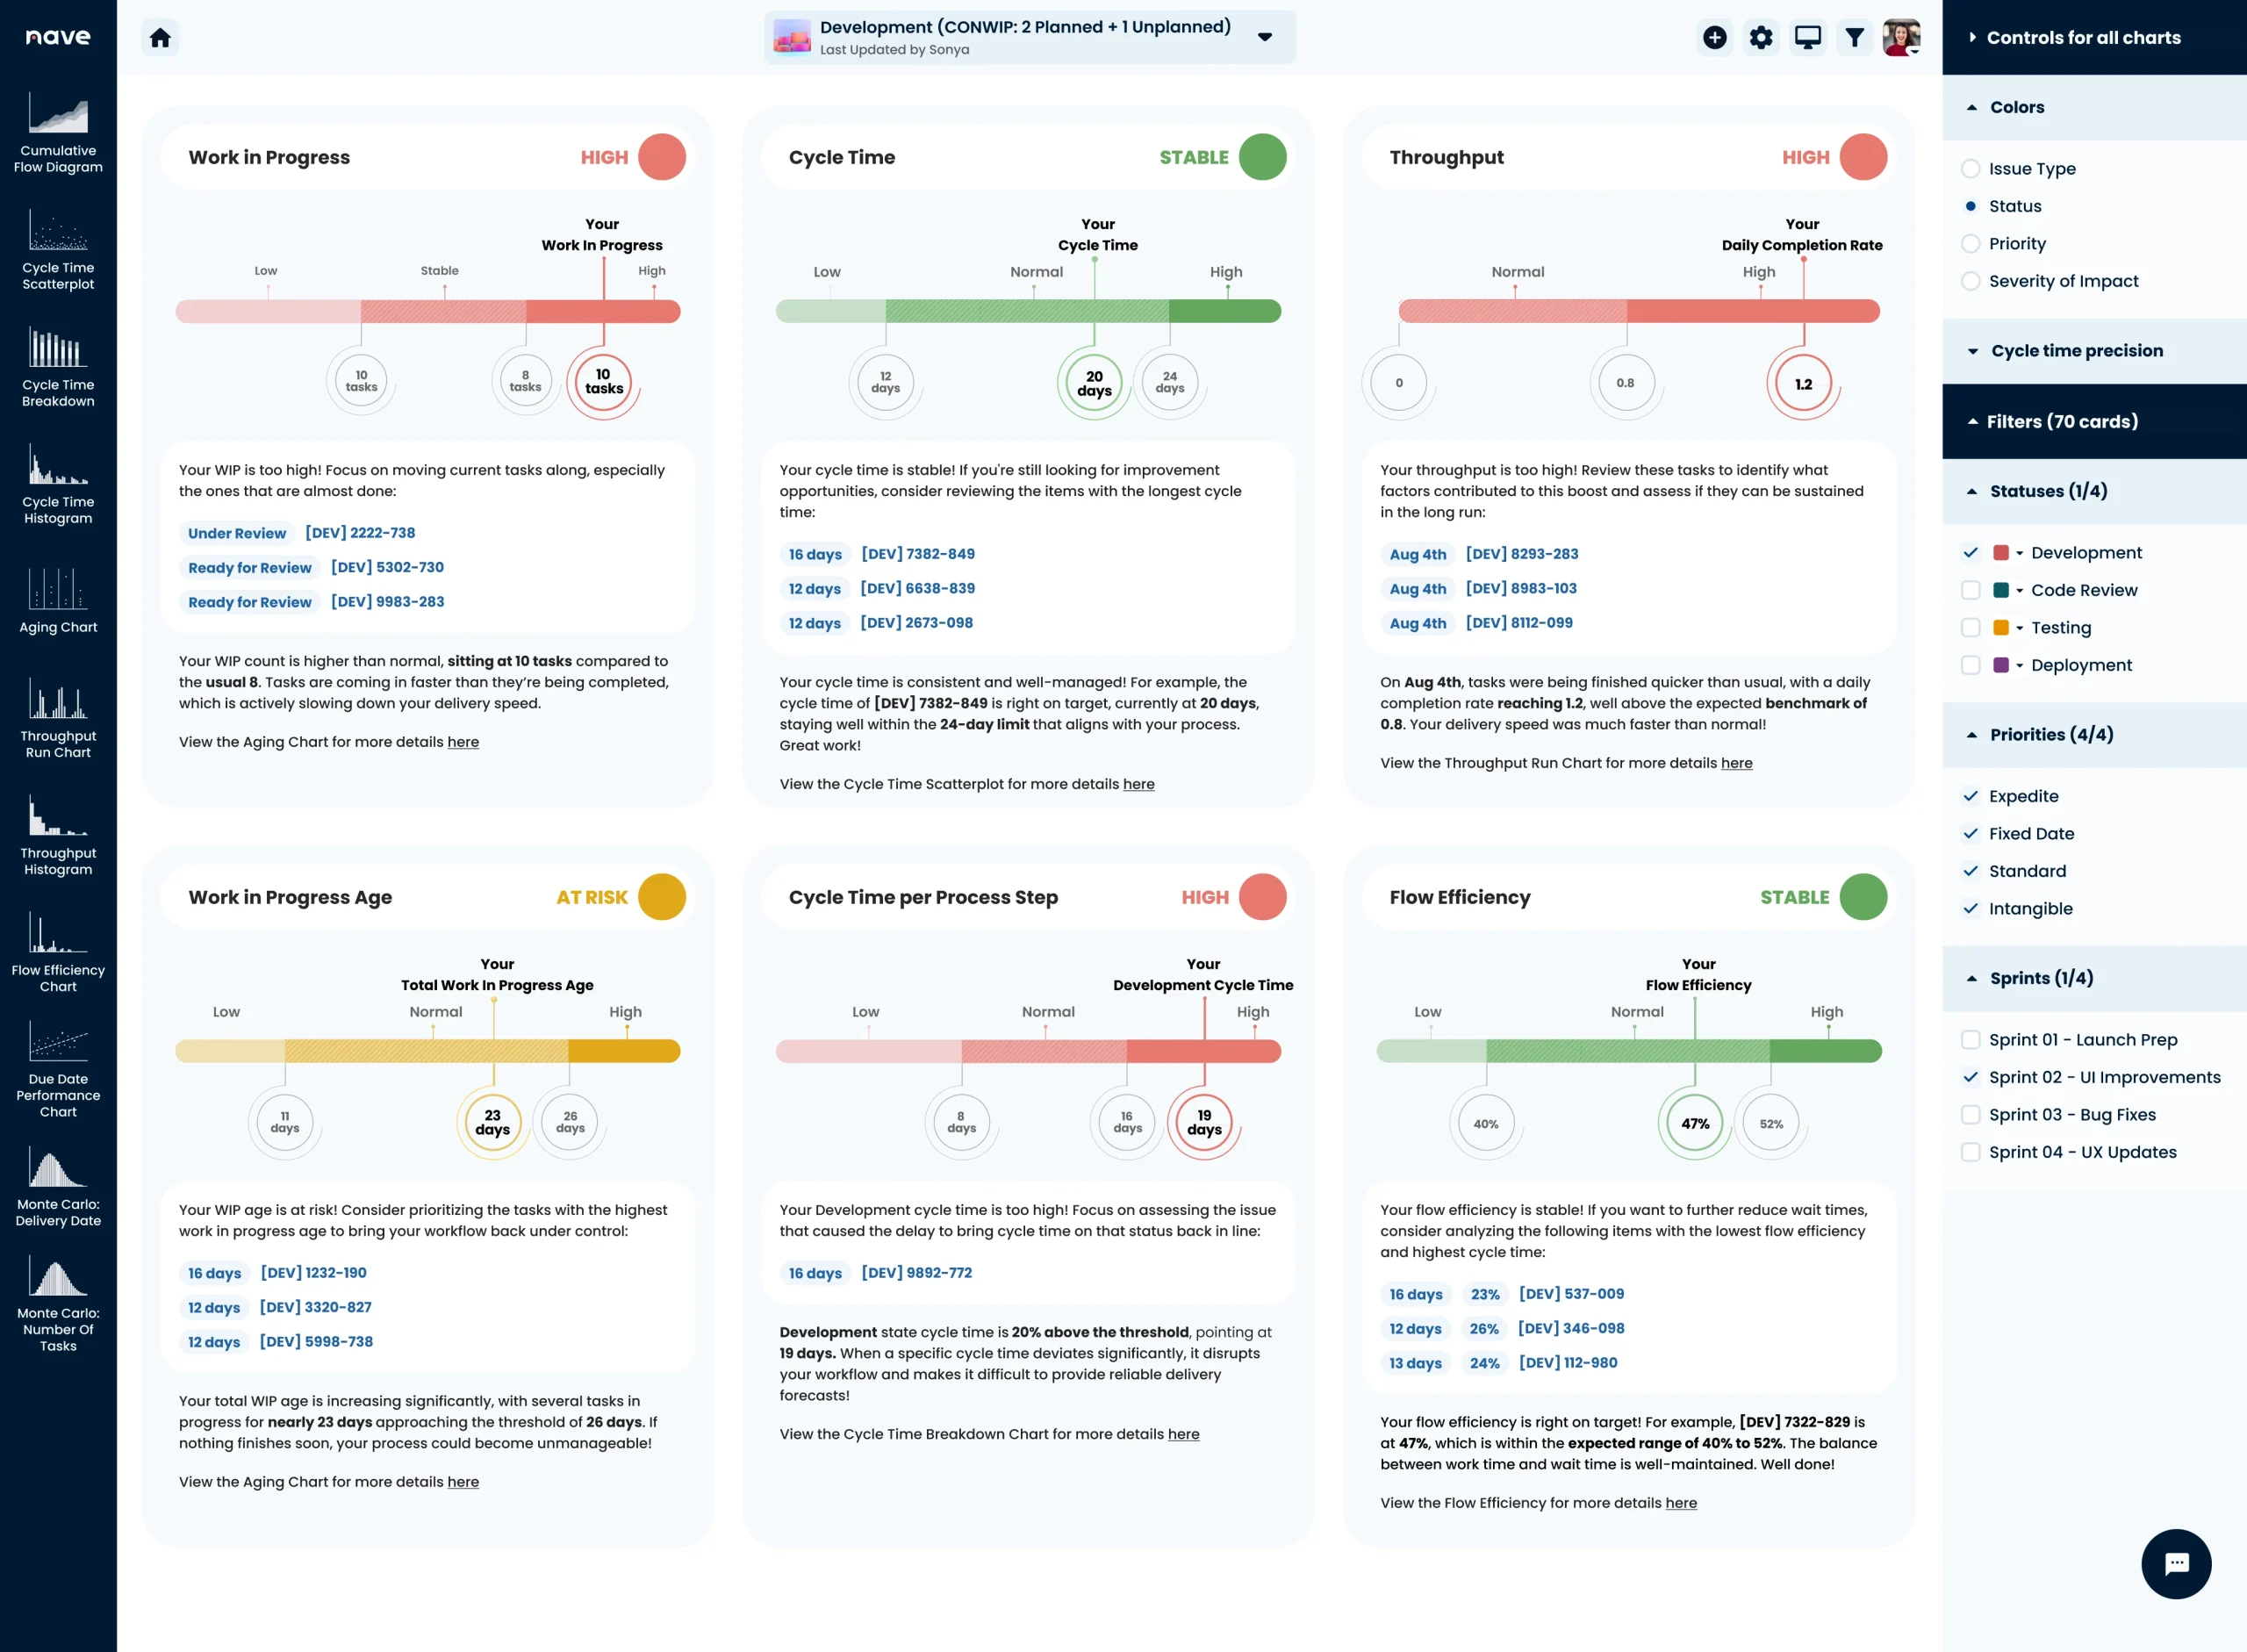
Take It Further with the Process Improvement Dashboard
Now that we’ve covered the essential detection rules, it’s time to apply them to your own data.
Our Process Improvement Dashboard uses these same principles to help you detect both strong and moderate signals in your flow metrics. It flags process shifts in real time, highlights when it’s time to take action, and provides insights on what steps to take to get back on track.
Agile teams across the globe use the Nave Analytics suite to identify opportunities for improvement and deliver better products faster! Try it free for 14 days and see how it helps you take control of your process →
Next week, we’ll dive even deeper into how to make the most of your flow metrics using your natural process limits. I’ll show you how to apply these principles to your cycle time and what actions you can take to improve your process. Stay tuned for more insights!
Thanks for reading, and see you next Thursday, same time and place for more managerial insights!
Bye for now!
Source: Vacanti, D. “Actionable Agile Metrics for Predictability Volume II”

Hi Sonya.
Maybe it’s worth to explicitly mention, that the ‘sigma’ in this case has nothing to do with Standard Deviations, which are often associated with that Greek letter.
The process limits of a XmR Chart are calculated based on a method, that is more robust regarding non-normal distributions.
Great point, Bruno!