

When it comes to making delivery commitments, mapping story points to hours to estimate your work is a terrible piece of advice. In fact, there is a very simple exercise that can be used to reveal this paradox.
Bar Vaccin (Haute Cookure) is a small cozy place in Oostmalle, Flanders, here in Belgium. For those of you who have stuck around for a while, you already know that apart from heavyweight boxing, I’m also addicted to French cuisine. Bar Vaccin is a wonderful Michelin star restaurant and even if it wasn’t located only 10 km away from our house, I’d still always go back for our birthdays, anniversaries, and any other special occasions we celebrate. Over time, it also has become my favorite place to meet with potential customers who are looking to adopt Nave within their organization.
The last time I went there was a few months ago, just before pandemic precautions required the place to close, and I met with the technical director of a big media company. With a glass of Vaccin’s famous namesake cocktail, we were talking about their main problem – lack of predictability.
There was something that she said which particularly struck me: “When we meet with the teams and they say this story is 2 story points, I do the math in my mind (1 point is approx. 3 days) and I know right away it will take 6 days. If they say, the story is 8 points, that would translate to about 3 weeks. However, I don’t understand why this approach always ends up wrong!”.
Well, let’s dig deeper into it!
Compare Story Points of Completed Stories With Their Cycle Time
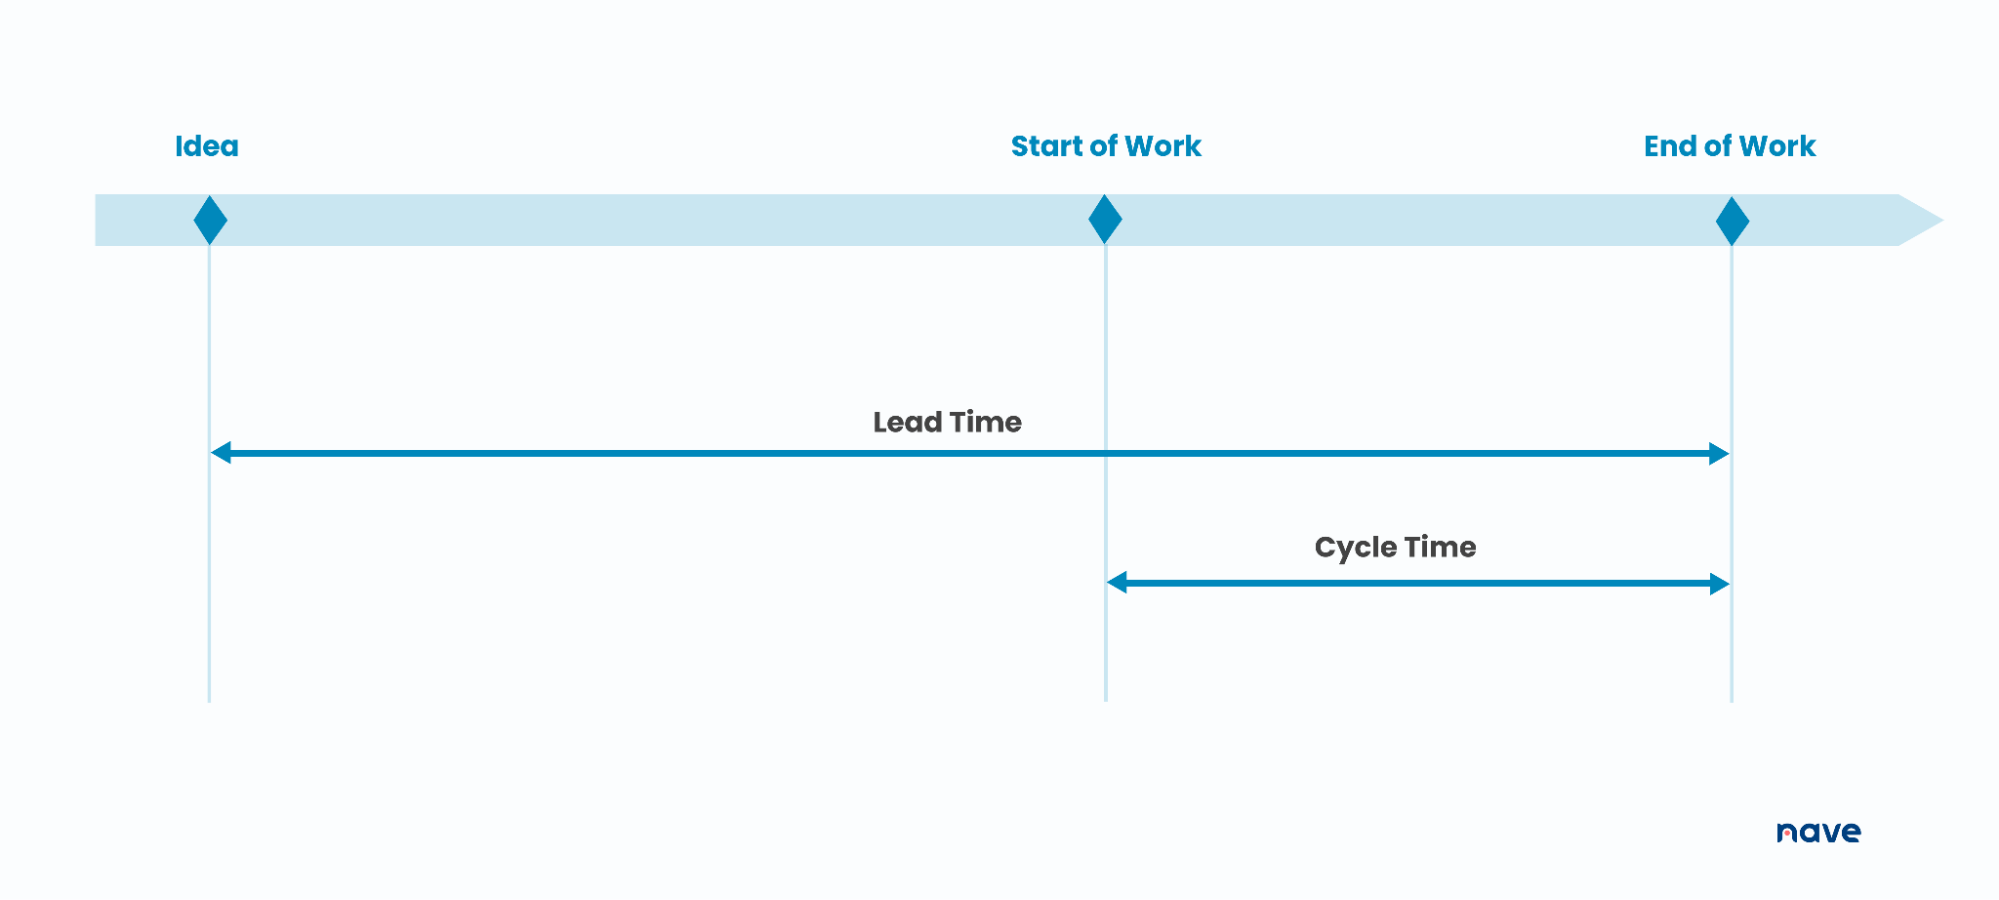
Before we begin, let’s clarify that when we talk about cycle time, we are talking about the amount of elapsed time between the moment a work item starts and when it finishes.
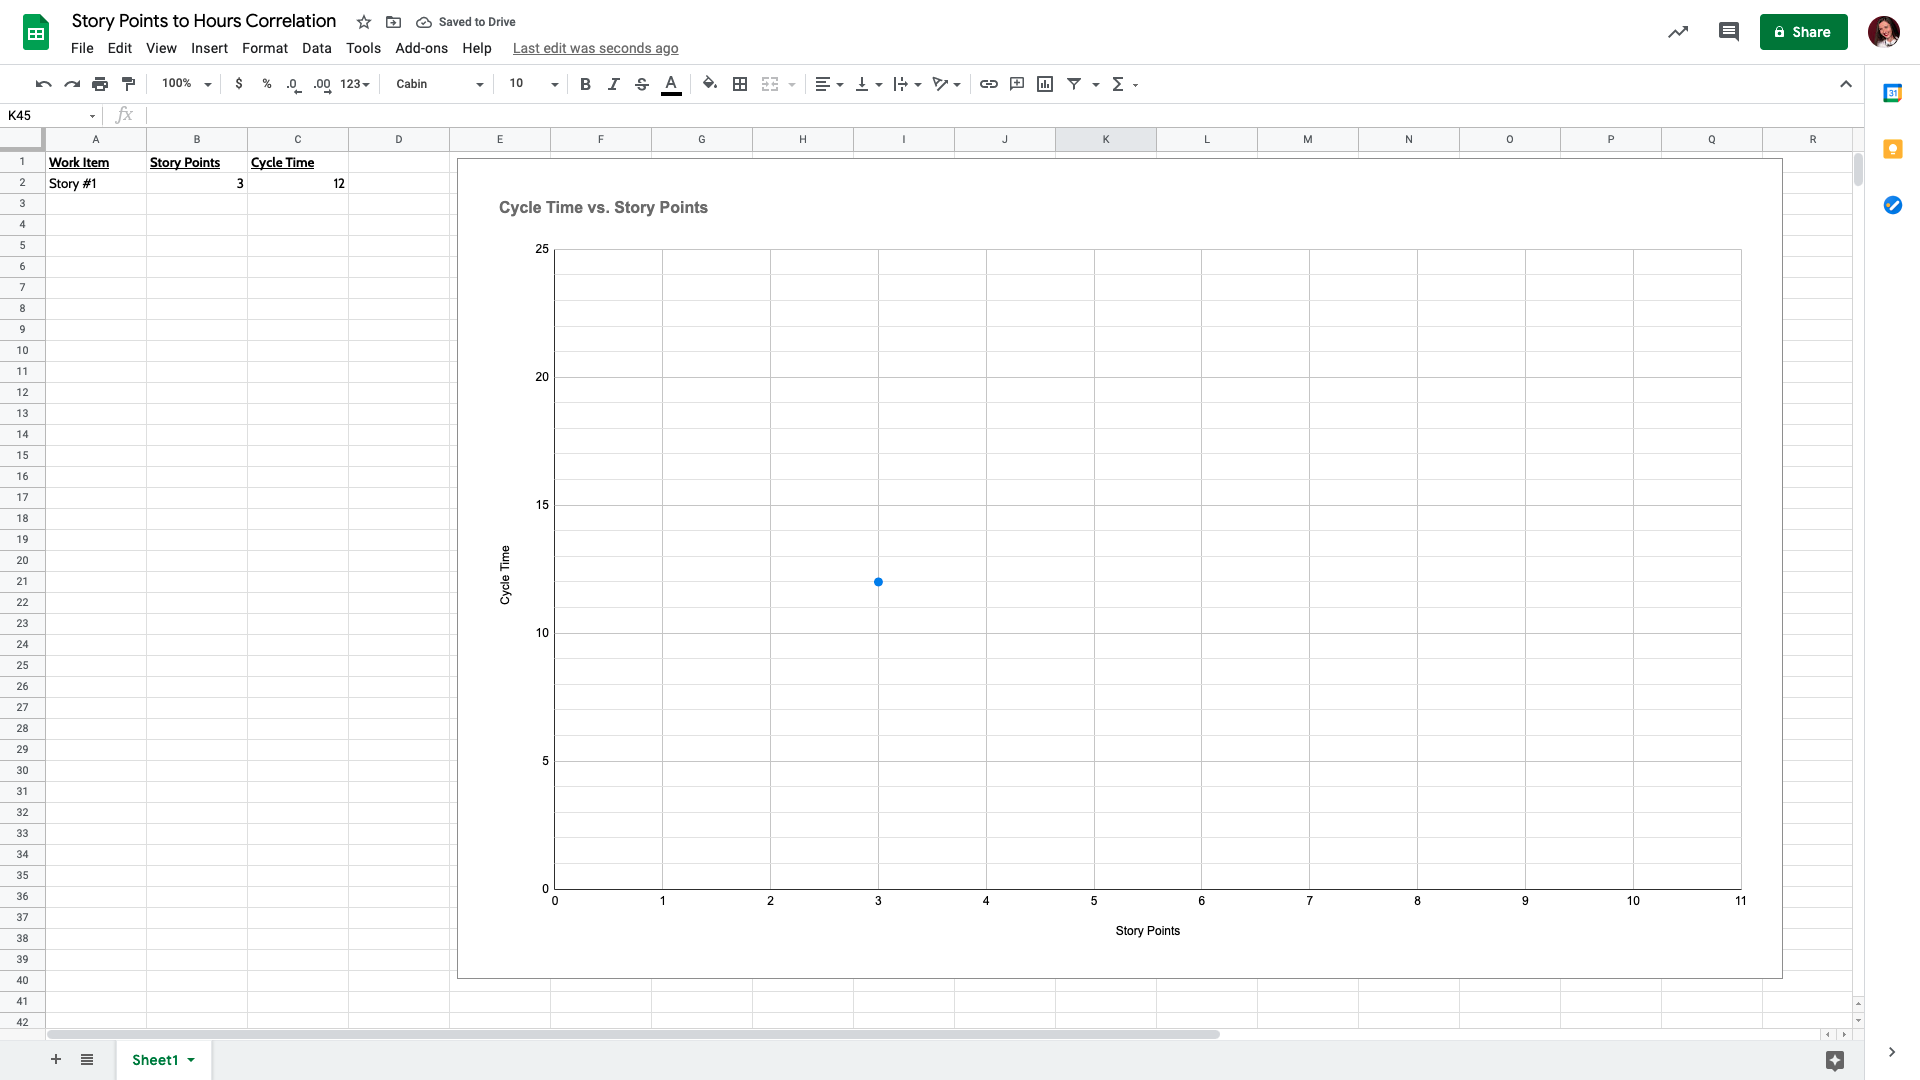
Let’s do an exercise. Let’s build a scatterplot with story points on the X-axis and cycle time on the Y-axis. We’ll define 1, 2, 3, 5, and 8 points on the X-axis (you can adjust these values based on your own context). Now, let’s plot how many days have taken for a story assigned with 3 story points to be completed. In this example, that story needed 12 days to be finished.
Now, let’s map story points to hours for the last 20 to 30 completed stories. For each work item, add the story points to column B in the “Story points to hours correlation” spreadsheet and then add the actual cycle time it has taken to complete the item to column C.
Moving on, we would expect that items with 1 story point will be relatively quick to complete and as the story point value goes up, the time that an item has taken will slightly increase.
This is what the correlation between story points and cycle times looks like for one of the media company development teams we talked about in bar Vaccin:
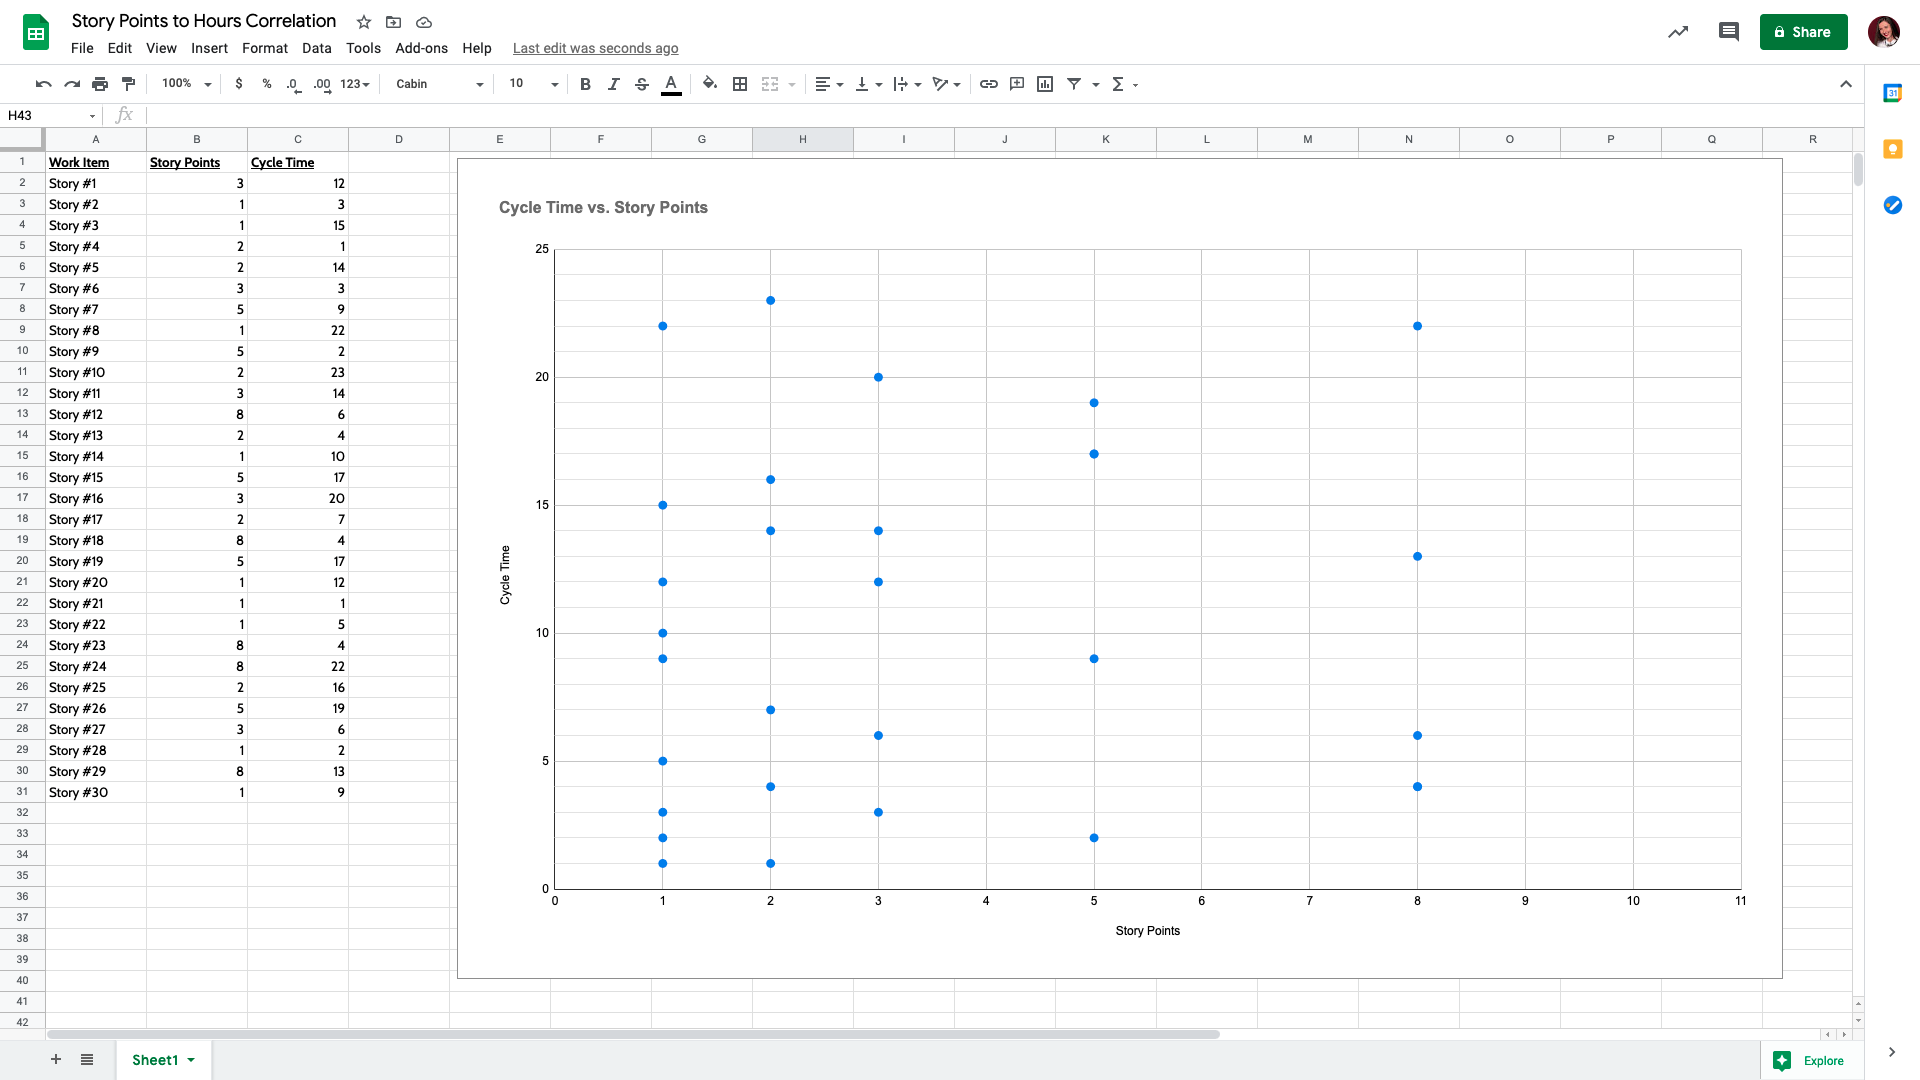
If you look into the cycle times perspective, the items with 1 story point can range from anything between 1 day all the way up to 22 days. The same results are observed for items with 2 story points and 3 story points. The most surprising trend is that their 8 point stories are in the same date range as the items with 1 story point.
Use the “Story points to hours correlation” spreadsheet to map your own data and visualize whether or not there is a correlation between story points estimation and the actual time required to complete your work. The main purpose of the chart is to serve as evidence to prove that story points should not be mapped to hours. Doing this exercise is supposed to be a one-time effort, the results of which would hopefully call this vicious practice into question. Providing proof based on your historical performance is the best approach to communicating the fact that converting story points into hours will land you in hot water.
If you haven’t registered for Nave yet, you can do it here →
It’s free for 14 days, no CC required! It will take just a couple of minutes to come up with a reliable delivery forecast.
STORY POINTS TO HOURS CORRELATION SPREADSHEET
Use this spreadsheet to map your own data to prove that story points should not be mapped to hours and call this vicious practice into question.
Are You Getting the Right Value From Story Points?
It’s obvious that mapping story points to hours is not a reliable approach to take when making delivery commitments. In fact, you should never resort to story point estimation again – there are far more effective alternatives, which will enable you to make accurate future predictions.
Now, the question is, are you getting the right value from story points?
When we talk about story points, the number itself shouldn’t be that important. The actual conversation behind what needs to be done and how you can do it are the most important things. In fact, probably the main benefit of story points is that they trigger this conversation.
There is a need to clearly differentiate the analysis process and the forecasting process. Think about how much time you’re spending arguing whether something is taking 5 points or 8 points. If you have a team of 10 people and you spend 1 hour per week on estimating your work using story points, that’s 10 hours per week that can be spent doing the actual work instead. Gaining an understanding of the problem you’re trying to solve is essential. Not the points themselves. If this all sounds familiar, it would be worth calling your current practice into question and looking for an alternative trigger for these conversations.
Last but definitely not least, talking about story points is the wrong way to communicate with your customers. Have you ever tried to explain to a customer what ‘8 story points’ mean? Story points estimation doesn’t speak their language. Your clients don’t think in terms of story points. They think in terms of elapsed time, they think in terms of “When will this be done?”.
In our Sustainable Predictability program, we dive deeper into the proven strategies that enable you to give a confident answer to the “When will this be done?” question and meet your customer’s expectations.
Mapping Story Points to Hours Is Terrible Advice
Even though plenty of management platforms provide the feature of mapping story points to hours, don’t fall into the trap of heading in this direction. It will only compromise your ability to make reliable delivery predictions.
Use story points to spark the conversation around the work that needs to be done, in order to come up with the most feasible solution that brings value to your customers. And always keep in mind that time spent actually doing the work is way more valuable than the time spent arguing about the number behind the work itself.
Thanks for tuning in. I’ll see you next week, same time and place for more managerial goodness. Bye for now!

I do agree with the basic thrust of the article, when it comes to not converting story points to hours. That said, the standard story point vs. cycle time graph that you present (standard, meaning it’s a common point made by #NoEstimates proponents) should more wisely evoke responses other than “never resort to story point estimation again”. For example,
1) WHY would an 8-point story have been completed so quickly? (4 days! That’s faster than 90% of all stories). What drove that? And why did the 1-point item take 22 days? These are clear outliers that deserve some level of scrutiny, both about practices and about process bottlenecks that could be addressed.
2) In short, rather than jump to outright rejection of story points, look inward: are our estimation practices flawed in some ways? How could we address these outliers and maybe lessen their occurrence next time? For example, do people throw out a story point number without sufficient thought, and move on quickly if there’s no argument, perhaps because it’s almost lunchtime etc.? Do we sometimes begin work on an item too early, and then incur wait time that could possibly be prevented?
Finally, I question the very notion of comparing story points (which are a combined abstract estimate of size/complexity/capacity drain for each item) to cycle time. Doing so ignores other key factors, unrelated to item size etc, that contribute to cycle time: priority of the item, the specific person assigned, sequencing, etc. Just because Mary Superstar completed the item in 4 days doesn’t mean that it wasn’t an 8 in size/complexity, because Joe Intern might have taken 22 days to do it. The data is by nature muddled, and trying to glean cut-and-dried correlations from it is risky, as is jumping to conclusions that a correlation doesn’t exist between an item’s basic size and the “capacity slice” of the team’s overall workload that it will carve away.
I also reject the “time spent actually doing the work is way better than time spent arguing about the number” trope that also accompanies many such articles pleading the case for #NoEstimates. It’s not much different from assertions like “just lemme code” or “planning is worthless”. SOME amount of planning, judicious and right-sized, for any non-trivial endeavor shouldn’t be dismissed as “not as good as time spent doing the work”. And yes, assessing size/complexity of the work is a key part of planning, in any realm; the two aspects can’t be viably separated.
Hi Peter,
First of all, thank you very much for spending the time and effort to give your 2 cents on the matter! I really appreciate it!
We’re not followers of the #NoEstimates movement. We only work with numbers and make conclusions based on the evidence we discover.
Let me provide some more context that hopefully will cover your points. Whenever you’re unhiding information, you need to take action on it. The act of exposing the information has the sole goal to reveal an opportunity for improvement. The example we outlined in this article is for a new team that consists of the top specialists in the technology this company is developing. They are extremely good to predict how much time they will need to finish the work.
The next step was to perform an analysis of their delivery system. It turned out that in 60% of the cases, the work was blocked by external dependencies. Additionally, their work generated plenty of waiting time due to the bottleneck in their workflow. The QA specialists struggled to handle all the work produced by the developers and as such the work was stuck in the middle of the process.
The bottom line is, their delivery times were drastically impacted by the waiting time in their system. That’s not something that can be predicted estimating the effort of the work, regardless of its granularity level. Taking this outcome further, it became obvious that the practice of estimating the work by converting story points to hours (which is the topic of this article) was flawed.
When it comes to making delivery predictions, I firmly believe that the main goal is to manage risks and more specifically, to mitigate the risks as much as possible.
The realm of probability is all about managing risks when we make delivery commitments. We need to be able to quantify the risk we’re dealing with to make reliable future predictions. Neither story point estimation nor hours or days estimation can provide the certainty of achieving our goals. Probabilistic forecasting is the way to go, and we’ve added our 2 cents on that matter in this piece of content https://getnave.com/blog/release-planning/
Finally, we’ve made a clear differentiation between analyzing the work (which is a must) and estimating the work. The goal of this article is to bring more awareness to the matter. Did you know that there are 20 people per day on average searching for information about how to map story points to hours? I strongly believe that each and every one of these people need a different perspective to be able to call that antipattern into question!
Thanks for replying, Sonya. I do appreciate your thoughtful approach to all this. I’m a little confused though, because it doesn’t seem to me that you addressed my specific points. We do, though, have some common ground.
At core here, in my view, is a misunderstanding by many that story points somehow represent a time estimate. They don’t. They’re not a schedule; they’re input (among many other factors) to constructing a schedule. They’re an abstract assessment of size/complexity/risk/capacity drain for the team overall, and thus we shouldn’t expect them to map very cleanly, particularly *as individual items*, to the actual time consumed, for the various reasons I mentioned. So yes, as your article pointed out, it makes no sense to convert story points to hours, and as stated, I concur.
My issue, as stated in my previous note, is the use of a graph to triumphantly “prove” a much stronger conclusion than just “don’t convert story points to hours”: to wit, “you should never resort to story point estimation again”. As I said, there are many reasons (e.g., wait time) that cycle time can diverge from correlating to story points, BUT I emphasized that those root causes should be the focus for improvements, rather than deciding to completely ditch the notion of incorporating estimated item size into one’s analysis and discussions. (I’m puzzled, too, by your insistence that the team behind the graph “are extremely good to predict how much time they will need to finish the work”, because the whole point you were making by presenting the graph is that their predictions *didn’t* correlate well to actual cycle time.)
But anyway, common ground:
– we agree that analysis and risk management matters most (although I’d emphasize that analysis is the very foundation of worthwhile estimation practices, not somehow separate or “differentiated” as you said)
– we agree that no one should be mapping story points directly to hours, although I’d emphasize that showing a graph as you did represents a core and incorrect assumption that they SHOULD map, and concluding erroneously that if they don’t, story points must therefore be worthless. There are, however, many valid reasons to use story points, and I’ve covered some of them in my own two-part post, at http://www.peterkretzman.com/2018/10/24/quocknipucks-or-why-story-points-make-sense-part-1/.
Hi Peter,
Let me address your specific points one by one.
“Use of a graph to triumphantly “prove” a much stronger conclusion than just “don’t convert story points to hours”” – That’s a surprising conclusion. I don’t see how the article leads to it. The mention of the statement “you should never resort to story point estimation again” has its link assigned to it, and it is a totally different conversation that has nothing to do with converting story points into hours.
“The team behind the graph “are extremely good to predict how much time they will need to finish the work” – Yes, they are extremely good in predicting the EFFORT of the work, which in turn has nothing do to with the actual delivery time of the work (proved by the variability observed in their delivery times). I hope this makes it more clear. The effort for a work item, regardless of how it is measured, doesn’t correlate with delivery times. There is more to it, as you already stated.
“Although I’d emphasize that analysis is the very foundation of worthwhile estimation practices, not somehow separate or “differentiated” as you said” – In the article I pointed you out in my first comment, we prove that making delivery predictions (either to plan your releases or to come up with a delivery date) can be done using Monte Carlo simulations based on the throughput of the system. That process is highly accurate and effective when the delivery workflow is stable and predictable, and it could be very well separated from the analysis of the work (if the delivery workflow is not predictable, no method can produce reliable results quantifying the risks you’re managing).
“I’d emphasize that showing a graph as you did represents a core and incorrect assumption that they SHOULD map, and concluding erroneously that if they don’t, story points must therefore be worthless” – That conclusion is even more surprising that your first one, and if anyone reading this post comes up with the same, I’d point this out explicitely – the main purpose of the chart should be to serve as an evidence to prove that story points should not be mapped to hours since there is no correlation between them. Adding your data to the chart is supposed to be a one-time effort, the results of which would hopefully call the practice of mapping story points to hours into question.
I’d like to close this conversation by acknowledging that I really appreciate your contribution, Peter, your input is valuable!
Thank you for the detailed analysis. Your comments make more sense.
Saira,
I’m glad you find it useful!
I really appreciate this article. It makes a clear, strong case on story point estimation causing more harm than good. The dark spot I see in the discussion is that while Kanban and flow systems can support a much better and clearer method for estimating, most teams–especially embedded software, feature, “cost-center” teams–that are expected to answer estimation questions don’t have a great way of standardizing what a unit of “work” is. A “ticket” is just as useless as a “point” for that sort of metric. When asked “when will that thing be done?” and one looks into the past data and sees nothing but noise about tickets and task sizes with nothing in common, it’s tough to do any better than guess from the gut. I’d love to see more guidance in that problem space.
It’s not really about the size of the story. It’s about implementing (and following!) the rules to keep the delivery times of those same various sized tasks consistent.
Here are a few resources that dig into that.
https://getnave.com/blog/managing-items-of-different-sizes-in-kanban/
https://getnave.com/blog/explicit-policies/
Hope this helps! 😊
Just look at the percentiles of your cycle times for your work items to predict the elapsed time of a future item. All your work items have a certain distribution of their size and cycle times.
If, e.g., 85% of your finished items took let’s say 20 days or less, than there’s a 85% of a future item to stay 20 days or less in your workflow. Size doesn’t actually matter in this case, it’s implicitly in your historic data.
If you want to forecast the time when a bunch of tickets are done, use throughput data and Monte Carlo Simulations. They will give you a probability and a range, e.g., 40 items will be done in 14 or less days with a confidence of 85%.
What you look at might be mistaken as “noise”, but it’s not. It’s showing your company’s constraints implicitly.
And by the way: another thing with SP is that they most likely violate linearity. If you estimate an item with 2 SP you expect an item with 8 SP as being “4 times as big”. Otherwise all velocity calculations are doomed. In practice, a 8 SP item might be “5 times as big” or “3 times as big”. Then adding up SP in your next sprint planning won’t work out, because adding up a 2 SP item and some 8 SP items will lead you to a false velocity.
As the article shows, there’s no correlation between SP and elapsed time and thus linearity is violated.
Cheers
Great article.
I conducted a similar experiment with our company data some months ago. Our teams estimate in hours and skip the “SP-to-hour-transformation”. The result was very much the same.
The elapsed time to estimated hours showed a correlation close to zero, meaning that estimates were more or less useless to answer the question “when will it be done” or “how much will be done in the next sprint”.
As a matter of fact, our burn down charts almost always show horizontal lines (they show “remaining effort in hours” which is an estimate, too).
With extracted throughput data and a little Monte Carlo Magic, I was able to show that A) our sprints were always overbooked (at least by a factor of 4 or 5) and B) in 85% of all forecasts the predicted range of finished work was correct (no surprise: the confidence was set to 85%).
I presented my results to a bunch of decision makers (people leads, POs, directors) and their reactions were astonishment and disbelief. They couldn’t get the point that our estimates are worthless. The most stubborn reaction was “then we have to get more accurate”. Dear, oh dear!
Historical data is so much better when it comes to forecasts since they implicitly contain all the company’s constraints—waiting times, blockers, rework, loops, bottlenecks, just to name a few.
From my perspective, any estimation is waste that needs to be reduced as much as possible. You probably cannot avoid it totally, but it’s probably fair enough to decide whether or not a story or task can be finished within a day or two (plus it’s sometimes useful to get a common understanding among the developers and testers).
The latest thing I heard from our top management was that all backlogs needed to be estimated upfront—all epics, all stories, all tasks, all current bugs. As a Scrum Master I made clear that’s not agile at all, and if they insist on doing so, they cannot count on my support for this insanity.
So, my message is clear: trust your own data, make evidence based decisions, skip estimating (as much as possible) and simply focus on the most valuable outcome.
Cheers
There’s even more to that …
In the meantime, I’ve looked at this for more than 2 dozen teams and teams-of-teams. And I didn’t find just one with a high correlation. From that I conclude that it’s unlikely to be a matter of proficiency in estimating.
In contrast to a lack of correlation between Cycle-Time and estimated SP, Velocity – i.e. Throughput measured in SP – and Throughput measured in work items per time typically highly correlate; I found just one counterexample. From that I conclude that if estimation is done for reasons of capacity – i.e. answering the question “How much can be done until X?” – counting work items is equally effective, but more efficient.
Well, nothing new for the Kanban Community, but it’s good to see that being backed up by real-world evidence.