

If your team is constantly overcommitting and underdelivering, chances are you have a capacity allocation problem.
Now, I didn’t say resource allocation, right? There is a difference there.
Capacity allocation is a strategy used to manage and optimize the workload of a team, especially when dealing with unplanned or expedited work. It’s all about knowing how much work your team can handle and making smart decisions based on that knowledge.
Simply put, resource allocation is about assigning specific tasks to team members. Think of it as who is doing what. On the other hand, capacity analysis is about understanding how much work your team can realistically complete within a certain timeframe. It’s more about the “how much” rather than the “who.”
Today, we’ll focus on capacity analysis. Why? Because knowing your team’s capacity is exactly what will resolve the overcommitment problem.
The Foundation of Capacity Allocation
Before allocating capacity, it’s essential to perform a capability analysis. What this means is that you have to understand your team’s throughput and how many work items they can handle within a given time frame.
The capacity of your team is measured by the rate at which they deliver work. And when I say “deliver,” I mean completed tasks, not tasks that are in progress or almost done. It’s all about what’s finished within a given sprint.
To determine your capacity, you need to look into your past performance data. Evaluate how many items you have completed per sprint over the past 3 to 6 months. This historical data gives you insights into what your team can realistically achieve.
This is where the Throughput Histogram comes into play.
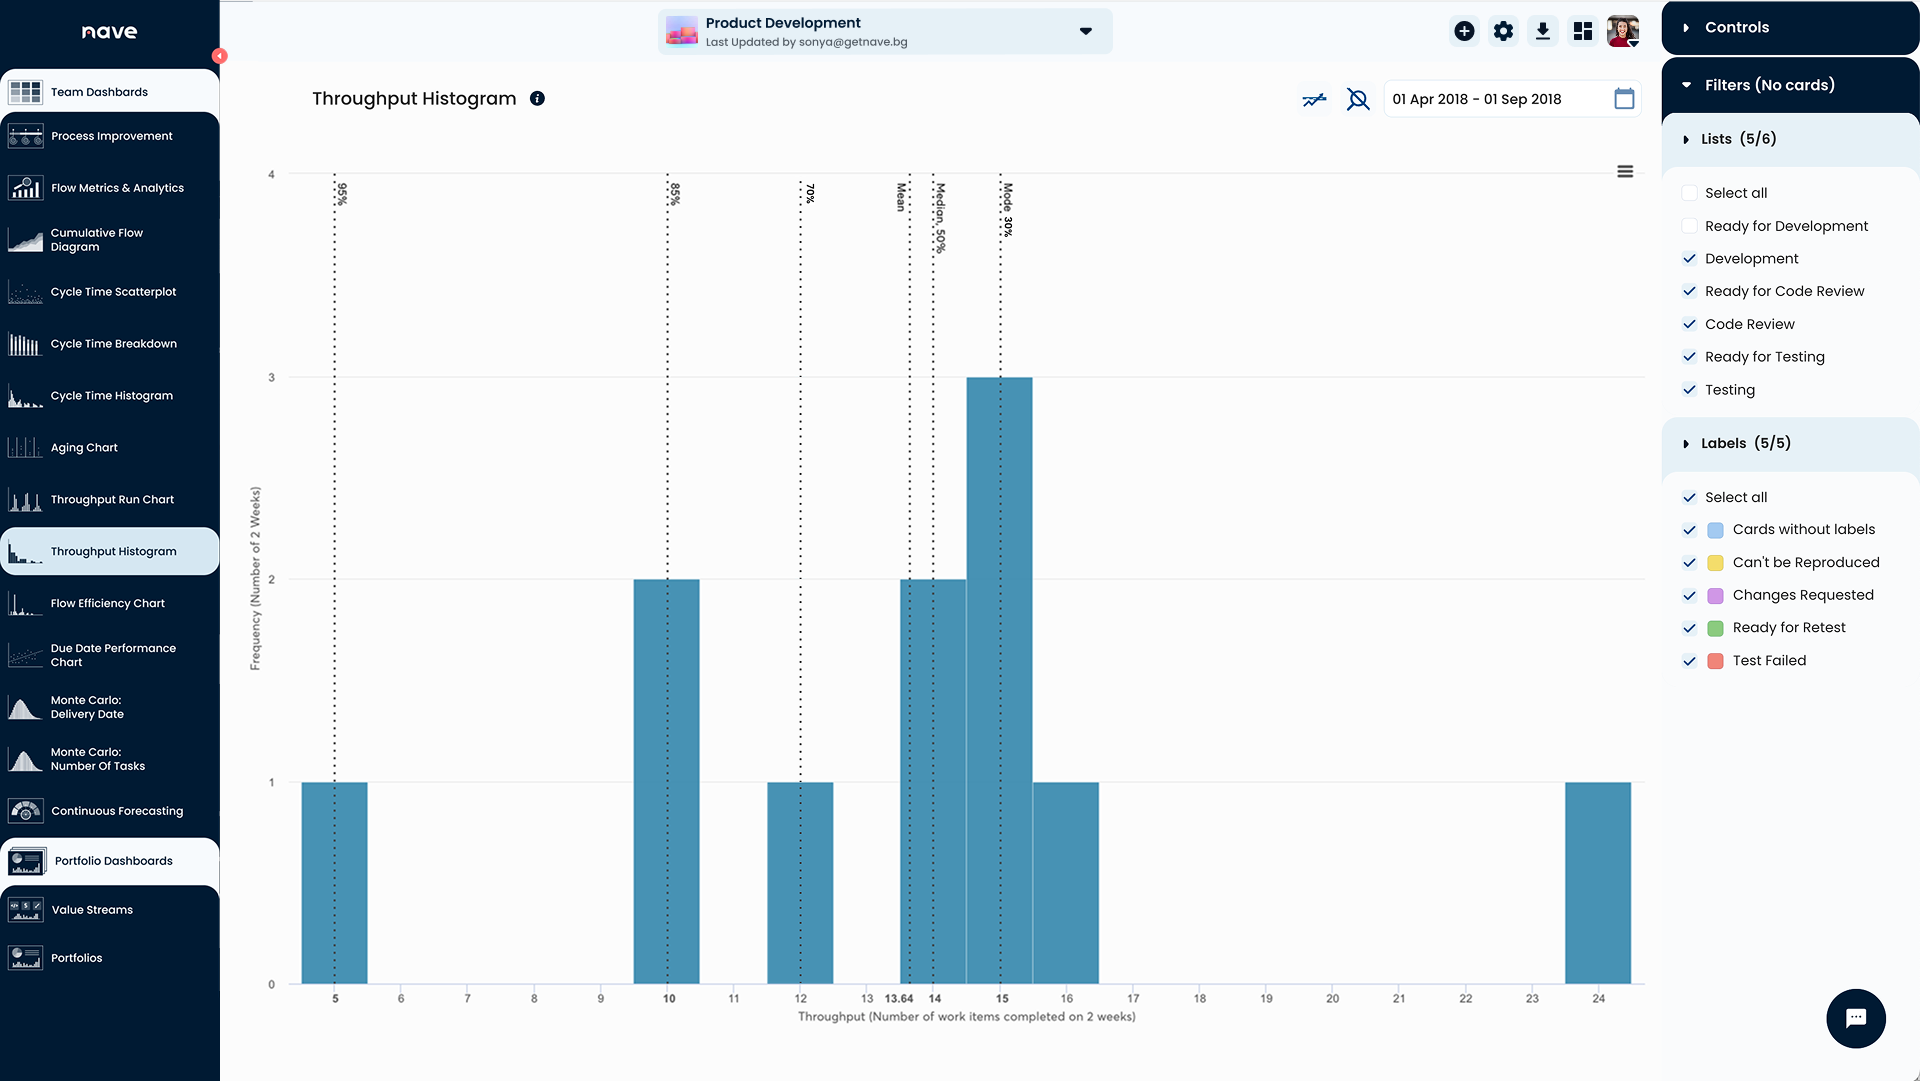
Agile teams use the Throughput Histogram by Nave to visualize their past performance and set realistic expectations for future sprints.
The Throughput Histogram shows the number of items you completed in a certain period. To track the number of tasks delivered per sprint, group your data by 2-week intervals, and make sure to set the start date of the dashboard to match the start of a sprint.
Over the past 6 months, the team above had:
- 1 sprint where they managed to deliver 5 items.
- 2 sprints where they finished 10 items.
- 1 sprint with 12 items.
- 2 sprints with 14 items.
With this analysis, they can now make informed decisions for their next Sprint Planning.
Here’s how to read the numbers:
- Minimum Capacity: The team can confidently schedule at least 5 items in the next sprint. This is their absolute minimum, and there’s a 98% certainty they’ll hit this target.
- Probable Capacity: There’s an 85% chance of delivering at least 10 items and a 70% chance of finishing more than 12 items.
- Maximum Capacity: While this team once finished 24 items in a sprint, achieving this consistently is unlikely (less than a 30% probability). If they commit to this number, some work will likely be rescheduled for the next iteration.
Use this information as a guide to determine the number of product backlog items necessary to achieve your sprint goal. And if your team commits to a number with low confidence of achievement, question that commitment. And remember, analyzing throughput is about understanding your actual capability to deliver.
Strategies for Effective Capacity Allocation
Now that you know your capacity, let’s talk about how to allocate it effectively.
- Prioritize critical work: The first 5 slots should be reserved for the most important work. This ensures that high-priority tasks are completed first.
- Fill in the gaps: As you move to fill additional slots, the importance of the work can decrease. But remember, the more slots you fill, the higher the chance that work might move to the next iteration.
- Monitor aging work: As the team starts pulling work into the process, keep an eye on your Aging Chart to ensure tasks aren’t artificially aging. Pay attention to anything nearing the 14-day mark and keep the team’s focus there.
Capacity allocation is all about understanding your team’s throughput and making informed decisions to optimize workload.
By performing capability analysis and using tools like the Throughput Histogram, you can align your team’s efforts with realistic goals and increase your chances of hitting your targets consistently.
Here is your action item: If you haven’t connected Nave to your management tool, now is the time! It’s free for 14 days, no strings attached →
I hope you found the concept of capacity allocation helpful. If so, make sure to share it with your teammates. I’d love to hear from you! Send me a note on LinkedIn and tell me what you see on your Throughput Histogram. I’d love to hear more about how you leverage this strategy and what benefits it brings for you.
I wish you a productive day ahead, and I’ll see you next week, same time and place, for more managerial goodness! Bye for now.
